Custom dashboards list
Overview
Custom dashboards under Analytics let you build personal or shared boards of widgets over public procurement data — notice volumes, company KPIs, authority trends, and competitive gaps. Unlike Home assistant chat (conversational, one-off answers), dashboards are persistent layouts you revisit for pipeline reviews, account planning, and executive briefings.
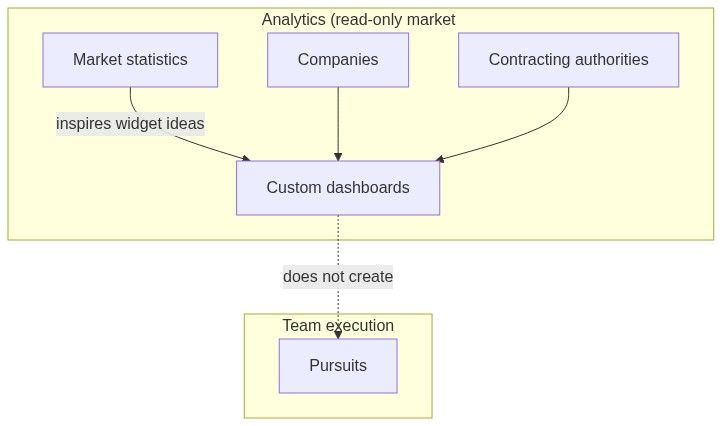
Dashboards read the same aggregated market database as Market statistics and profile pages, but you choose which metrics appear, how they are filtered, and how colleagues see them. They do not create pursuits or edit notices — they are read-only intelligence surfaces.
Tip: Before you build your first dashboard, confirm you have:
Signed in with a plan that includes Analytics → Dashboards
Decided whether the board is personal (only you edit) or shared (team visibility)
A clear question — e.g. "How is our CPV segment trending in RO vs. competitors?"
Bookmarked Market statistics for default aggregates when a custom widget is overkill
Important: Dashboard widgets show market data, not your team's pursuit pipeline. Active bids live under Team → Pursuits. Use dashboards for strategy; use pursuits for execution.
Dashboards vs other Analytics surfaces
How to open
Open the app sidebar.
Expand Analytics.
Click Dashboards.
You land on the dashboard list — cards or rows for every dashboard you own or that was shared with you.
Page layout
Dashboard list
Each saved dashboard row or card typically shows:
Create panel
New dashboard opens an inline create form:
Enter a dashboard name (descriptive — e.g. "Q3 RO medical devices — competitive watch").
Click Submit (or equivalent create action).
Tendersight creates an empty dashboard and navigates directly to the editor.
Empty dashboards have no widgets until you add them from the catalog in the editor.
Typical workflows
Workflow A — Personal monitoring board
Use when one analyst tracks a niche without involving the whole team.
Analytics → Dashboards → New dashboard.
Name the board after the question it answers.
In the editor, add widgets from the catalog (see Edit dashboard).
Configure filters — country, CPV, date range, specific company or authority.
Resize and arrange widgets on the grid.
Return weekly from the list page — open the same dashboard by name.
Workflow B — Shared team board
Use for bid managers who want one canonical view in Monday reviews.
Create the dashboard as above.
Configure sharing so colleagues can view or edit (permissions depend on your plan and team policy).
Share the dashboard name in your internal channel — colleagues open Analytics → Dashboards and select it from the list.
Agree who may edit layout vs. who consumes read-only.
Caution: Two editors rearranging widgets simultaneously can overwrite each other's layout. Coordinate edits or designate one dashboard owner.
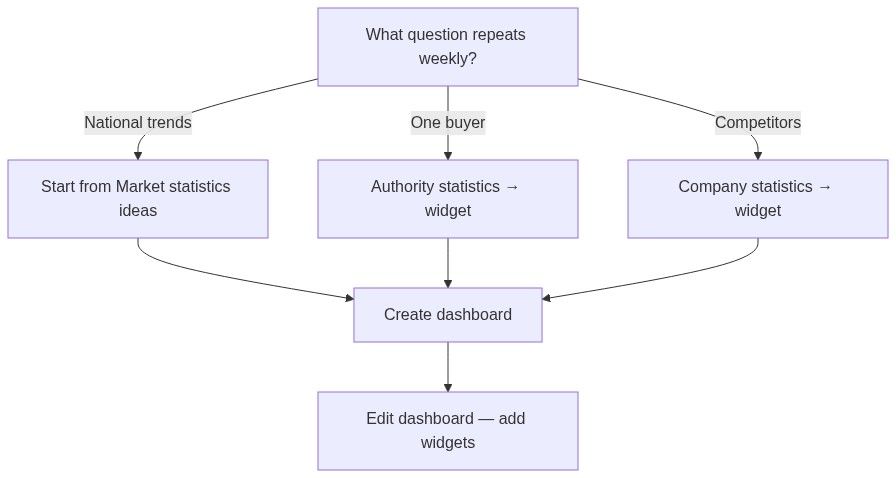
Workflow C — From research to widget
Use when company or authority research sparks a recurring metric.
Research a buyer on Contracting authorities directory → Statistics.
Note a metric you want weekly (e.g. top suppliers, seasonality).
Dashboards → New dashboard → add an entity card or chart widget pointing at that authority or CPV slice.
Save — the list page becomes your entry point.
Sharing and permissions
Shared dashboards appear in your list alongside personal boards — look for the owner name and shared badge before deleting (you can only delete boards you own).
Guests or unsigned users generally cannot access custom dashboards. Sign in and verify subscription features if the Dashboards menu item is missing.
What you can and cannot do
You can
Create unlimited dashboards (subject to plan limits if any)
Add chart, indicator, entity card, and map widgets
Filter widgets by CPV, country, date, authority, company
Open linked entity profiles from entity card widgets
Delete dashboards you own
You cannot
Edit underlying notice or company records from a widget
Create a pursuit from a dashboard click-through
Export widget data to CSV on every widget type (use screenshots or dedicated export where UI offers it)
Force real-time sync — aggregates refresh on Tendersight's data pipeline schedule
Relationship to notices and pursuits
Analytics informs bid/no-bid; pursuits hold your answers and pricing.
Edge cases
Recommended setup (new teams)
Skim Market statistics once — note which charts you would revisit.
Create one personal dashboard with 3–5 widgets max (clarity beats density).
After Getting started workflow, add a competitive gap widget if your plan includes it and fiscal ID matches.
Promote to shared only when layout is stable.
FAQ
What is the difference between dashboards and Market statistics?
Market statistics is a fixed, curated analytics page. Custom dashboards let you compose your own widget grid and save layouts.
Can dashboards replace alerts?
No. Alerts notify you when new notices match rules. Dashboards show aggregated history and trends.
Do dashboards show my team's pursuits?
No. Pursuit data is team-private. Dashboards show public procurement aggregates and market company/authority profiles.
Who can delete a shared dashboard?
Only the owner (creator). Viewers cannot delete shared boards.
Why does my widget show different numbers than a notice row?
Widgets aggregate many notices; a single notice row is one publication. Confirm filters (year, country, CPV) match.
Can I duplicate a dashboard?
Create a new dashboard and recreate widgets, or copy layout manually in the editor if your build supports duplicate (otherwise re-add from catalog).
Related articles
Edit dashboard
Market statistics
Companies directory
Contracting authorities directory
Notice (Tender)
Platform overview