Edit dashboard
Overview
The dashboard editor is where you arrange analytics widgets on a resizable grid, configure data sources (tenders, companies, contracting authorities), set filters, and preview live query results. Each widget is a mini-report — KPI indicator, time-series chart, entity summary card, or geographic map — backed by the same read-only procurement database as Market statistics.
You reach the editor from Dashboards list by opening any saved dashboard. Changes affect layout and widget configuration, not notices, pursuits, or directory records.
Tip: Before publishing a shared board, confirm you have:
Named the dashboard clearly on the list page
Set country, CPV, and date range on every chart (defaults can mislead)
Waited for each widget's success indicator after save
Opened entity card links to verify they point at the right company or authority
Important: Widgets display aggregated market intelligence. They do not write data. Creating a pursuit still happens on Notice overview or Team → Pursuits.
Editor layout

On narrow screens, sidebars may collapse — open the catalog before adding widgets, then switch to configuration when a widget is selected.
How to open
Analytics → Dashboards.
Click the dashboard you want to edit (or create a new one — you land in the editor immediately after creation).
The editor loads the saved grid; widgets fetch data in parallel.
Widget grid behavior
Arranging widgets
Drag a widget by its header to reposition on the grid.
Resize from corners or edges (grid-snapped layout).
Select a widget to open Configuration — filters apply to that card only unless you duplicate settings.
Each widget card shows:
Caution: Leaving the editor before a widget save completes can drop unsaved filter changes. Wait for the success indicator on the configuration panel.
Sidebar: Widget catalog
Open the Catalog tab to add widgets.
Add a widget — numbered steps
Open Catalog.
Click a widget type (e.g. Chart).
A new card appears on the grid — often with placeholder data until configured.
Select the card; switch to Configuration.
Choose source (tenders, companies, authorities).
Set filters and visualization options (below).
Save — wait for confirmation before adding the next widget.
Sidebar: Configuration
With a widget selected, the Configuration tab exposes:
Data source
Filters (common)
Visualization
Advanced builders let you combine conditions without leaving the dashboard. Incorrect expressions return empty charts — simplify filters and retry.
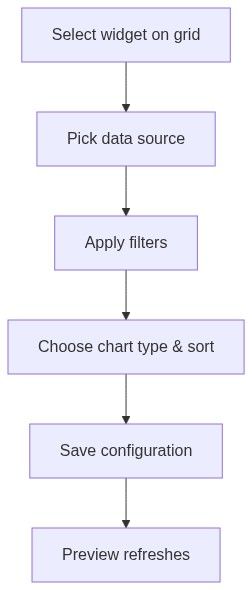
Save behavior
If a widget reverts after refresh, the save failed silently — re-open configuration and retry; check network.
Widget recipes (examples)
Recipe 1 — Authority seasonality for account planning
Add Chart widget.
Source: Contracting authorities (or tenders filtered to one authority).
Filter: your target buyer; last 5 years.
Visualization: monthly or quarterly breakdown.
Use in QBRs alongside Authority statistics profile tab.
Recipe 2 — Competitor win value indicator
Add Entity card for the company from Companies directory.
Add Indicator — total won value, same company filter.
Optional: Chart — won value by year for trend.
Recipe 3 — CPV market size
Add Chart — tenders source.
Filter: your onboarding CPV segment + home country.
Compare year-over-year before bid/no-bid meetings.
Link-through to detail pages
All link-throughs remain read-only. Create pursuit is not on the dashboard editor.
Permissions
Edge cases
What you cannot do in the editor
Edit notice deadlines or documents
Modify company directory records
Push widget data into a pursuit questionnaire
Subscribe to email alerts (use Opportunities → Alerts)
Recommended workflow
Start from a question, not from an empty grid.
Add at most five widgets per dashboard — split secondary questions into a second dashboard.
Align filters across widgets on the same board (same country + year).
Open entity links once to validate IDs.
Share only after a colleague dry-run on the list page.
FAQ
Do widgets update in real time?
Widgets refresh when you load the dashboard and when you save configuration. Underlying data syncs on Tendersight's import schedule — not per-second live tenders.
Can I clone a widget?
Duplicate via add + copy filter settings manually, or use duplicate control if your build exposes it on the widget menu.
Why does my chart show "gateway unavailable"?
The statistics backend timed out or is maintenance — retry; persistent failures may be platform-wide.
Can I embed a dashboard outside Tendersight?
No native embed in help scope — use screenshots or internal links to Analytics → Dashboards.
Advanced expression builder failed — now what?
Revert to basic filters (country + year + one CPV). Re-add complexity one condition at a time.
Does deleting a widget delete market data?
No. Only the dashboard layout loses that card.
Related articles
Dashboards list
Market statistics
Companies directory
Company statistics
Authority statistics
Notice (Tender)